Multiexponential Soccer’s Pythagorean Formula

5 04 2013

In the last post we derived simple soccer’s Pythagorean formula which gave us first satisfactory results in terms of RMSE.

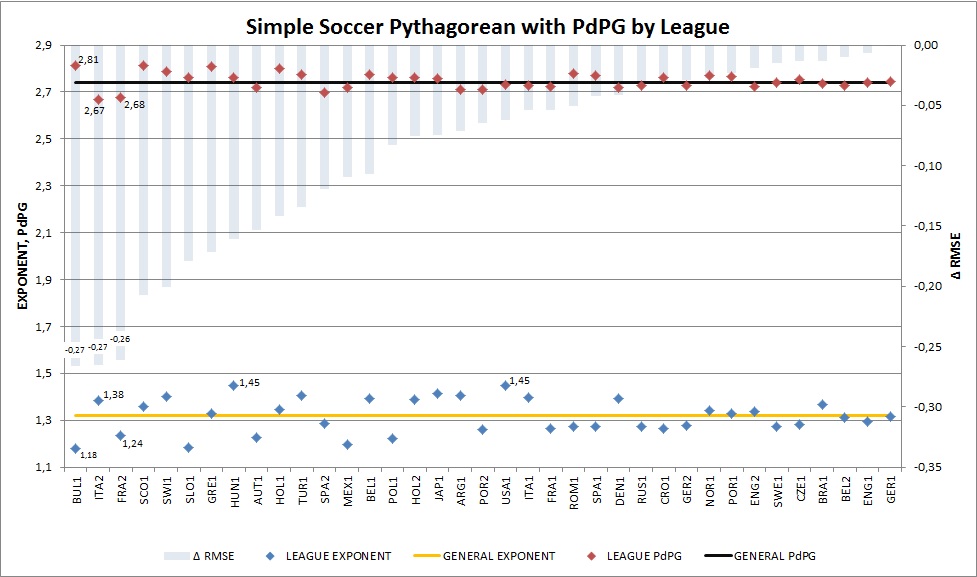
We found that general parameters (parameters calculated for all the leagues together) are stable over different time-frames and that application of league-specific parameters does reduce RMSE more significantly only in few cases, where PdPG (points distributed per game) for given league differs the most from general PdPG.


Today we will look at, what I call, multiexponential Soccer’s Pythagorean Formula (meSPF) – formula, which can have different values for different exponents.

Just as a reminder – we minimze RMSE on a dataset consisting of 37 major soccer leagues dating back (in most cases) to 1990’s -> altogether 9 961 team seasons.

Resulting formula (RMSE: 4.08, MAE: 3.27):

multiexponential Soccer's Pythagorean Formula

So we reduce RMSE by 0.08 and MAE by 0.06 as compared to simple Soccer’s Pythagorean Formula (sSPF).

This formula is also stable over time. Solving the equation over shorter time-frames (last 10, 5 and last 3 seasons), we reduce RMSE by less than 0.01 in each case.


sSPF vs meSPF approach: League-by-league comparison

Below graph presents comparison of RMSE between simple Soccer’s Pythagorean Formula and multiexponential Soccer’s Pythagorean Formula (both based on general, not league-specific, parameters):

multiexponential Soccer's Pythagorean: League RMSE

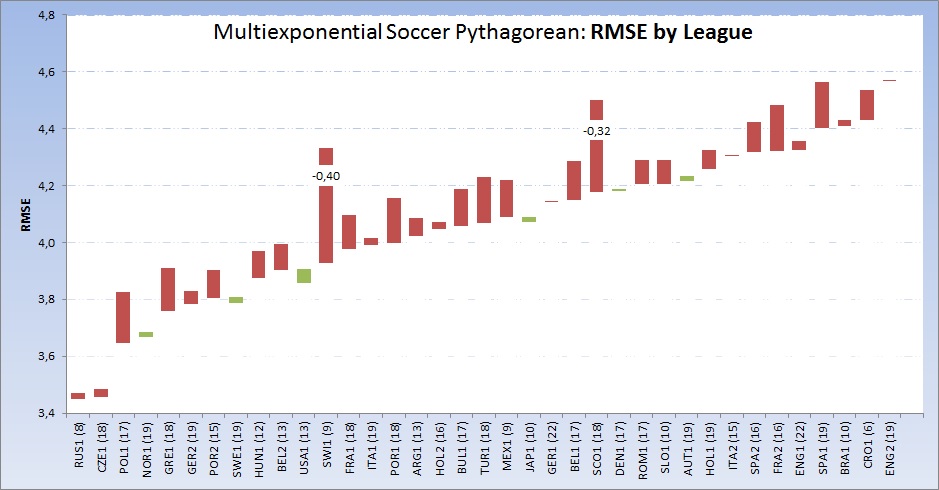
Red bars mean decrease of RMSE when applying meSPF, whereas green bars mean that RMSE increases

Only in few cases RMSE increases, but not substantially – the most in USA MLS (by 0.05).

For majority of leagues RMSE decreases – with exception of two leagues it decreases by not more than 0.18. Those two outliers are 1st Swiss League (decrease of RMSE by 0.40) and 1st Scottish League (decrease of RMSE by 0.32).


Outliers

It’s quite interesting that these two leagues stand out from the crowd – so let’s take a more detailed look at them.

For 1st Swiss League I have data from last 9 seasons and in 7 of them RMSE decreases by at least 0.37 (in other two cases it decreases by 0.23 and 0.02) when applying meSPF as compared to sSPF -> so this difference is permanent over time.

Below graph presents comparison of sSPF and meSPF approach for 1st Swiss League:

1st Swiss League: sSPF vs meSPF

All data are presented against Score Ratio (Goals for / Goals against), not Score Differential, as in Pythagorean Formula ratio is more meaningful than differential -> more on this in future post.

Actual points and Pythagorean Points (sSPF aproach) are presented in the upper part of the graph.

Notice in particular that for large Score Ratios (over 1.5) Pythagorean points (orange ones) are for the most part below actual points (blue ones). It seems that in this league better teams are able to gain more points than comparable teams in other soccer leagues and – as noted earlier – this pheomenon takes place since years.

Difference in Pythagorean Points between meSPF and sSPF approach is presented in the lower part of the graph. Green areas represent positive differences (meSPF Points > sSPF Points), whereas red areas present negative differences.

Notice that for very low and very high Score Ratios meSPF approach predicts higher points than sSPF approach (in most cases difference is up to 2 points), which results in a better fit to actual points.

Still differences between actual points and Pythagorean points are higher (for Score Ratios > 1.5 they are in the range of 3 – 9 points), which means that for this particular league ‘league-specific’ parameters can give us substantially better fit than general parameters.


For 1st Scottish League I have data from last 16 seasons and in 13 of them (and 10 of last 11) RMSE decreases by at least 0.21 when applying meSPF as compared to sSPF, so difference between sSPF and meSPF approach is also persistent over time.

Below graph presents comparison of sSPF and meSPF approach for 1st Scottish League:

1st Scottish League: sSPF vs meSPF

The same trend as in 1st Swiss League is visible here, although in 1st Scottish League we have even bigger outliers in terms of Score Ratio (naturally Rangers and Celtic) -> notice that for Score Ratio’s over 2.5, Pythagorean points (orange ones) are for the most part below actual points (blue ones) – and these points have biggest influence on error.

For these outliers meSPF approach predicts higher points than sSPF approach in the range of 2 – 6 points, which results in a better fit to actual points.

As the differences between actual points and Pythagorean points are not much higher, it seems that for this particular league ‘league-specific’ parameters will not give us substantially better fit than general parameters.


What impact on RMSE have parameters calculated for every league separately?

Below graph presents impact of league-specific parameters on RMSE:

meSPF: RMSE by League

The upper end of a bar represents RMSE based on general parameters, whereas lower end represents RMSE based on league-specific parameters.

There are few leagues, for which RMSE decreases by more than 0.20, but 1st Swiss League really stands out -> RMSE decreases by 0.46 when applying league-specific parameters, which only confirms earlier findings (better fit for teams with higher Score Ratios needed).

As a side note: RMSE for 1st Scottish League decreases by 0.08, and on average RMSE decreases by 0.11.


Distribution of average abolute error (MAE):

meSPF: MAE Distribution

Just as a reminder – this graph shows for how many observations (teams) Pythagorean points differ from actual points by given number, f.ex. for 50% of teams difference is no more than 2.79 -> altogether no big changes as compared to sSPF approach.


So we have the first version of meSPF, which slighlty improved fit to actual data as compared to sSPF.  We see that there are also few leagues in which teams behave significantly differently from general consensus.

There is still one additional wrinkle, which should improve the fit – but for it I invite You already to the next post.


Simple Soccer’s Pythagorean Formula (part II)

29 03 2013

In last post we started discussion on application of Pythagorean expectation in soccer. First results were not that encouraging, but – as was already pointed out – the issue was with ‘3 points for a win, 1 point for a draw’ rule in soccer.

This rule means that simple assumption:

Pythagorean Points = Win% * Number of Games * 3

is wrong, as number of points which can be re-distributed between participants in a game is on average lower (the maximum can be 3 points in case of one team win, but it can be also 2 points in case of draw)


What is the average number of points to be redistributed within the game (PdPG)?
I’ve made calculations on the same dataset described in previous post: 37 main soccer leagues from all over the world dating back (in majority cases) to 1990’s -> altogether 173 946 observations (games).

73% games in this dataset ended with a win of one of the teams, 27% of games ended with draw -> so average PdPG is 0.73 * 3 + 0.27 * 2 = 2.73.

Naturally this parameter varies between leagues, but only slightly, as in 29 leagues it is within 0.03 from mean.

Only 1st Bulgarian league is a bit of an outlier with PdPG = 2.81, as 81% of games ends there with a win. And from the other side PdPG in 2nd league in France and Italy is at 2.68.

You can check full list of leagues and their PdPG on the following graph:

PdPG by Leagues

This parameter is very stable over time, as in last 10 seasons, last 5 seasons and also in last 3 seasons average PdPG is the same: 2.73.


Right now we can calculate one more time Pythagorean exponent by minimizing RMSE between Pythagorean points (using in above formula 2.73 instead of 3) and actual points.

But I will do it differently – I will check which pair of parameters (Pythagorean exponent; PdPG) minimizes the error.

Results based on 9 961 obervations from 37 leagues: Pythagorean exponent = 1.32, PdPG = 2.74 -> RMSE = 4.16, MAE = 3.33.

So based on the regression we get nearly the same PdPG as the one calculated straight as average.


What will change if we will shorten time-frame?:

  • last 10 seasons: Pythagorean exponent = 1.34, PdPG = 2.74 -> RMSE = 4.08, MAE = 3.26
  • last 5 seasons: Pythagorean exponent = 1.34, PdPG = 2.74 -> RMSE = 4.06, MAE = 3.25
  • last 3 seasons: Pythagorean exponent = 1.33, PdPG = 2.74 -> RMSE = 4.02, MAE = 3.22

Errors slighlty decrease with lower number of observations, but parameters are very stable.


What impact on RMSE have parameters calculated for every league separately?

Below graph presents league specific parameters (Pythagorean exponent in the lower part and PdPG in the upper part + left scale) and ΔRMSE (blue shaded bars + right scale).

PdPG Pythagorean by Leagues

PdPB varies nearly in the same way as already discussed above: between 2.67 and 2.81. Pythagorean exponent varies between 1.18 and 1.45.

We can observe biggest decrease in RMSE in already mentioned 3 leagues, for which PdPG differs the most from general PdPG -> altogether for these leagues we would decrease RMSE by 0.27  and MAE by nearly 0.20 by applying league-specific parameters.


RMSE by league
It’s interesting to look at RMSE on a league level, as the differences are significant: from 3.47 in 1st Russian League to 4.57 in English Championship. Below graph presents RMSE by league, calculated on full-time dataset:

PdPG Pythagorean: RMSE

The upper end of a bar represents RMSE based on general parameters, whereas lower end represents RMSE based on league-specific parameters.

It seems that some leagues have much lower ‘volatility’ -> we will see in future post how it impacts predictions.


What’s important – as compared to first version of formula – is that this model is ‘symmetrical’ -> 49,7% of observations have negative error (Pythagorean points < actual points), 50.3% of observations have positive error (Pythagorean points > actual points).

Distribution of average abolute error (MAE):

PdPG Pythagorean: MAE Distribution

So for 50% of observations (teams) Pythagorean points differ from actual points by less than 2.85 points.

Definition of outliers is based on subjective thresholds You set – still I put some of them clearly on this graph, f.ex. there are 5% observations (509 teams), for which Pythagorean points differ from actual points by more than 8 points -> this means that on average we should expect one such over- or under- achieving team in the season.

In future posts we will take a look at over- and under-achievers -> and how it translates into predictions.


For now our general Soccer’s Pythagorean formula stands at:

Simple Soccer Pythagorean Formula


In the next post I will replicate Martin Eastwood’s work with, what I call, multiexponential Pythagorean formula to see what added accuracy we can gain.


Simple Soccer’s Pythagorean Formula

28 03 2013

Pythagorean expectation is a formula, which was derived by Bill James to estimate number of games a given team should win in baseball based on number of runs scored and allowed.

What does it mean should? Final outcome is not only result of skill but also luck. The more observations we have (f.ex. the more games played), the smaller role luck plays, but even after full season – when we applaud new champion – luck is still there (we will delve into it more in the future).

So in order to reduce impact of luck we need more observations – but it doesn’t mean only more games. We can also use events, which occur more frequently and which directly impact wins / losses -> like runs in baseball, points in basketball or goals in soccer -> and here comes Pythagorean expectation.

Since Bill James days Pythagorean expectation has been applied to other sports, like:

I will try to use this work to see what predictive knowledge we can gain by applying Pythagorean expectation to soccer. Can Pythagorean expectation tell us more about future outcomes than some basic indicators, like no. of points or score differential? We will see in future posts, but first, we have to establish Pythagorean formula in soccer.

We will start with basic formula, and in next posts we will add some wrinkles – still I want to keep things as simple as they can only be, so f.ex. I will not delve into most advanced and probably the most accurate derivation of Pythagorean soccer formula, which has been proposed by Howard Hamilton (for more info see Pythagorean Formula 2.0).


Simple Pythagorean formula (baseball):

PythagoreanFormula

So in baseball we use commonly 2 as an exponent, although it has been proved that 1.83 gives more accurate results.

In basketball many analysts have been using exponents between 13 and 16.5, whereas for NFL it’s assumed at 2.37.


What exponent should we apply in soccer?
To calculate it I used data from 37 main soccer leagues from all over the world – for most of them dating back to 1990’s -> altogether 580 seasons and 9961 observations (team seasons).

I used only regular season data (so without playoffs/play-outs, or subsequent splits into subgroups like championship / relegation, etc).

My aim was to minimize RMSE, which is average squared error between predicted and actual number of points.

In this first version of Soccer’s Pythagorean Formula I assume, that number of points = Win% * 3 due to ‘three point for a win’ rule in soccer.


The results: general exponent = 1.20, RMSE = 6.19, MAE (Mean Absolute Error) = 5.13.


Will we get better results, if we will apply different exponents for different leagues?
It seems, that it doesn’t have significant impact. League-specific exponents vary between 1.08 and 1.32 – > as presented on below graph (number in brackets after league abbreviation indicates number of seasons within analysis):

SimpleSoccerPythagorean

and by applying league-specific exponent we reduce RMSE (ΔRMSE in the graph + right scale) by max 0.15 and in majority of cases by only few bps.


What about consistency of general soccer exponent over time?
Below are the results for shorter time-frames:

-> last 10 seasons: exponent = 1.22, RMSE = 6.14, MAE (Mean Absolute Error) = 5.09, number of observations: 6 149

-> last 5 seasons:  exponent = 1.22, RMSE = 6.12, MAE (Mean Absolute Error) = 5.09, number of observations: 3 172

-> last 3 seasons:  exponent = 1.18, RMSE = 6.09, MAE (Mean Absolute Error) = 5.13, number of observations: 1 907

These results are very consistent, so it means, that for a basic soccer’s Pythagorean formula we can use 1.20 as general exponent.


Still, we can’t be satisfied with these results as RMSE is quite high -> in other sports (baseball, basketball) as well as in advanced Howard Hamilton’s Pythagorean Formula RMSE is at the level of 4 or lower. So what is the issue?

This simplified version of Soccer’s Pythagorean Formula overestimates number of points (for 85% of observations predicted number of points is higher than actual one). It’s due to a ‘three point for a win, one point for a draw’ rule in soccer, which means that number of points to be distributed within one particular game is either 2 (in case of draw) or 3 (in case of win).

But this is an issue for next post.